Edit chart
Loading graph
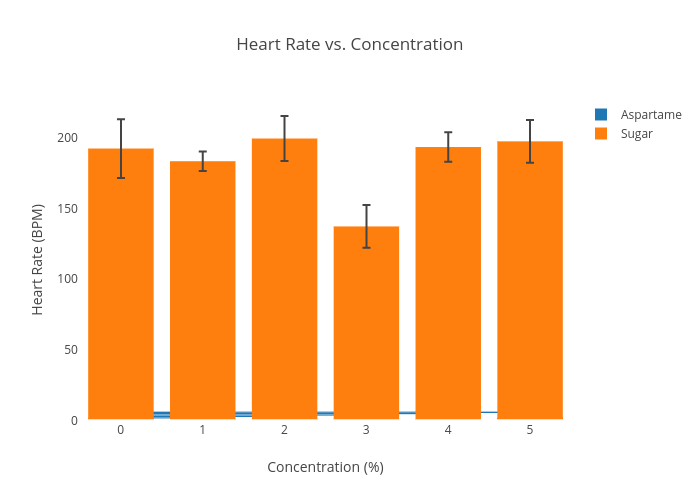
Saccok1's interactive graph and data of "Heart Rate vs. Concentration" is a bar chart, showing Aspartame vs Sugar; with Concentration (%) in the x-axis and Heart Rate (BPM) in the y-axis.. The x-axis shows values from -0.5 to 5.5. The y-axis shows values from 0 to 231.4277962736842.