Edit chart
Loading graph
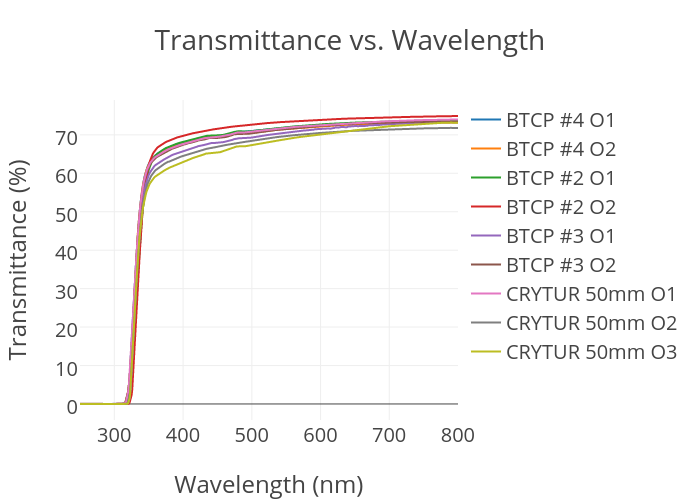
Runyonch's interactive graph and data of "Transmittance vs. Wavelength" is a scatter chart, showing BTCP #4 O1, BTCP #4 O2, BTCP #2 O1, BTCP #2 O2, BTCP #3 O1, BTCP #3 O2, CRYTUR 50mm O1 , CRYTUR 50mm O2, CRYTUR 50mm O3; with Wavelength (nm) in the x-axis and Transmittance (%) in the y-axis.. The x-axis shows values from 250 to 800. The y-axis shows values from -4.171441513888889 to 79.0573887638889.