Edit chart
Loading graph
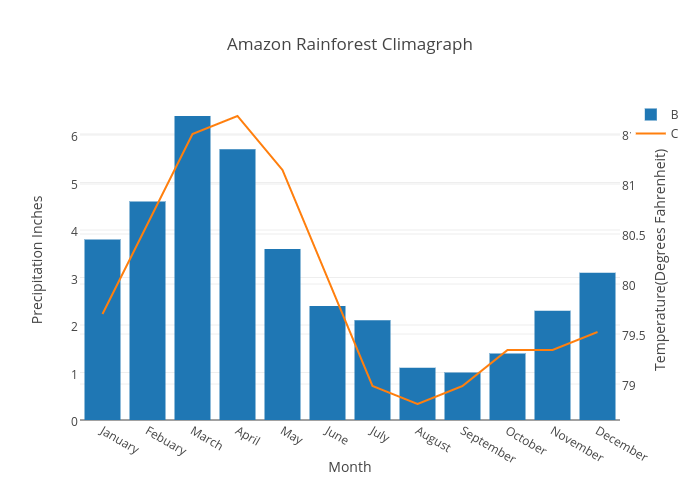
Rtpipala's interactive graph and data of "Amazon Rainforest Climagraph" is a bar chart, showing B vs C; with Month in the x-axis and Precipitation Inches in the y-axis.. The x-axis shows values from -0.5 to 11.5. The y-axis shows values from 0 to 6.736842105263158.