Edit chart
Loading graph
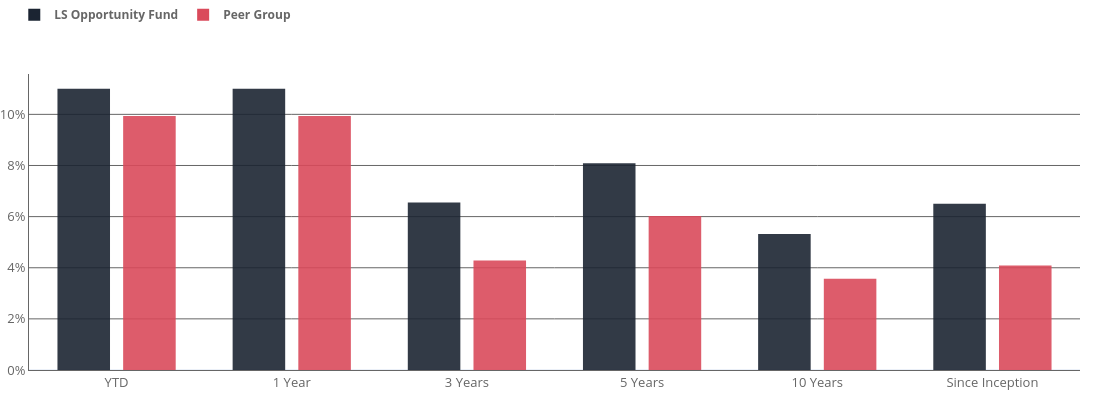
Rthibode's interactive graph and data of "" is a grouped bar chart, showing LS Opportunity Fund vs Peer Group. The x-axis shows values from -0.5 to 5.5. The y-axis shows values from 0 to 11.578947368421053.