Edit chart
Loading graph
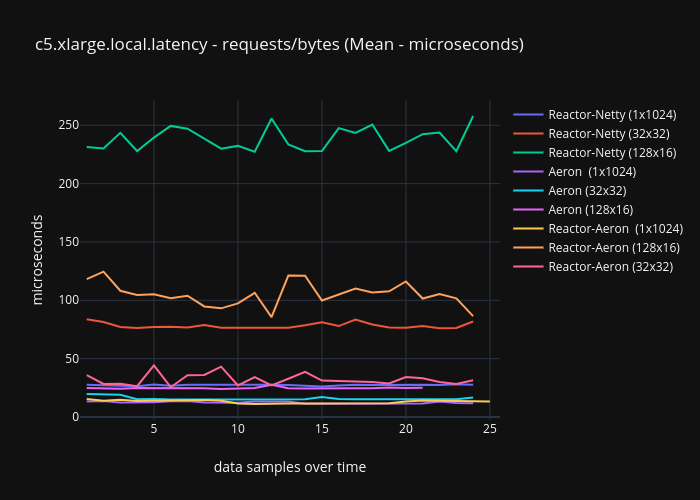
Ronenhamias's interactive graph and data of "c5.xlarge.local.latency - requests/bytes (Mean - microseconds)" is a line chart, showing Reactor-Netty (1x1024), Reactor-Netty (32x32), Reactor-Netty (128x16), Aeron (1x1024), Aeron (32x32), Aeron (128x16), Reactor-Aeron (1x1024), Reactor-Aeron (128x16), Reactor-Aeron (32x32); with data samples over time in the x-axis and microseconds in the y-axis.. The x-axis shows values from 0.6001846722068332 to 25.600184672206836. The y-axis shows values from -2.5997777777777777 to 271.65577777777776.