Edit chart
Loading graph
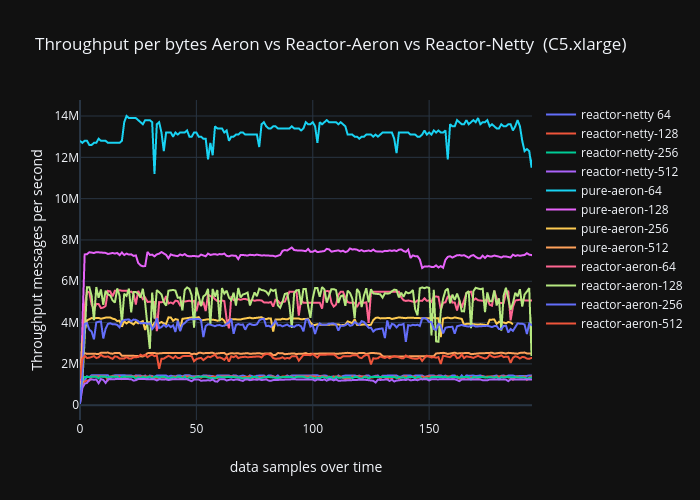
Ronenhamias's interactive graph and data of "Throughput per bytes Aeron vs Reactor-Aeron vs Reactor-Netty (C5.xlarge)" is a line chart, showing reactor-netty 64, reactor-netty-128, reactor-netty-256, reactor-netty-512, pure-aeron-64, pure-aeron-128, pure-aeron-256, pure-aeron-512, reactor-aeron-64, reactor-aeron-128, reactor-aeron-256, reactor-aeron-512; with data samples over time in the x-axis and Throughput messages per second in the y-axis.. The x-axis shows values from 0 to 194.19117788909105. The y-axis shows values from -715511.6111111111 to 14774500.611111112.