Edit chart
Loading graph
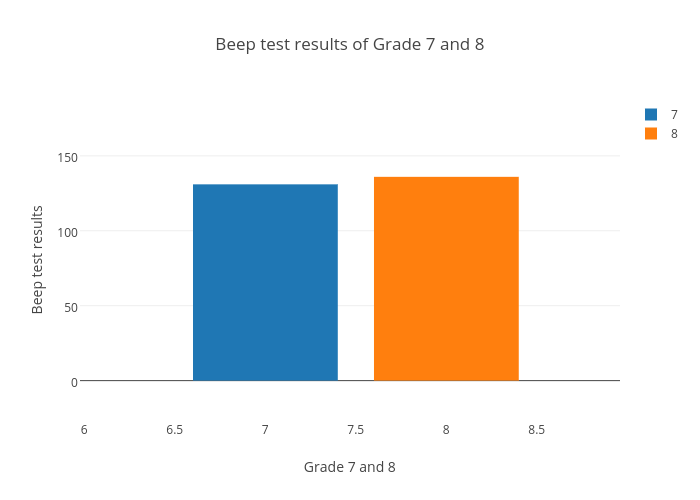
Rholls.tomsine's interactive graph and data of "Beep test results of Grade 7 and 8" is a histogram, showing 7 vs 8; with Grade 7 and 8 in the x-axis and Beep test results in the y-axis.. The x-axis shows values from 5.9756580563632 to 8.95930745164574. The y-axis shows values from -26.28154678251873 to 187.2849362482316.