Edit chart
Loading graph
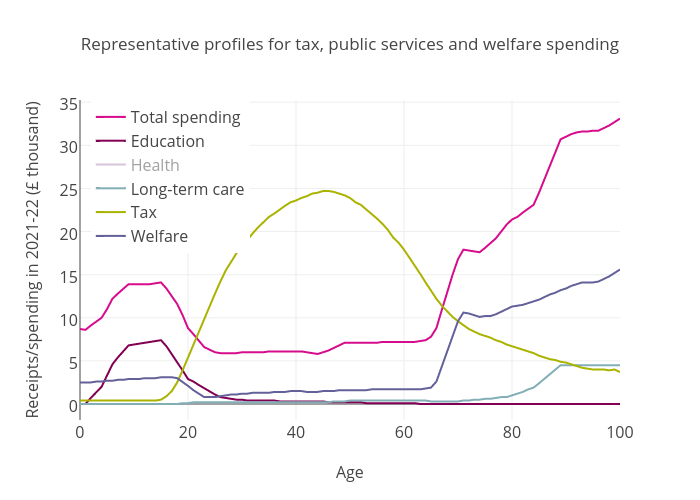
Reformthinktank's interactive graph and data of "Representative profiles for tax, public services and welfare spending" is a line chart, showing Total spending, Education, Health, Long-term care, Tax, Welfare; with Age in the x-axis and Receipts/spending in 2021-22 (£ thousand) in the y-axis.. The x-axis shows values from 0 to 100. The y-axis shows values from -1.8555555555555543 to 35.25555555555555.