Edit chart
Loading graph
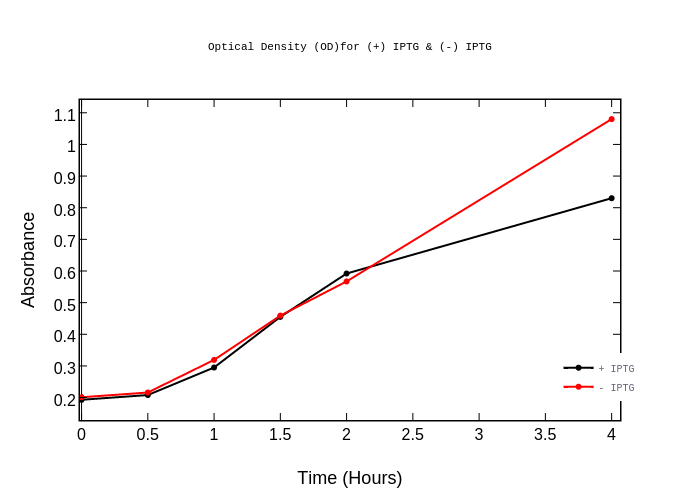
Reddy36's interactive graph and data of "Optical Density (OD)for (+) IPTG & (-) IPTG" is a line chart, showing + IPTG vs - IPTG; with Time (Hours) in the x-axis and Absorbance in the y-axis.. The x-axis shows values from -0.011745012385132494 to 4.063159823235491. The y-axis shows values from 0.12914299802761342 to 1.1403579881656802.