Edit chart
Loading graph
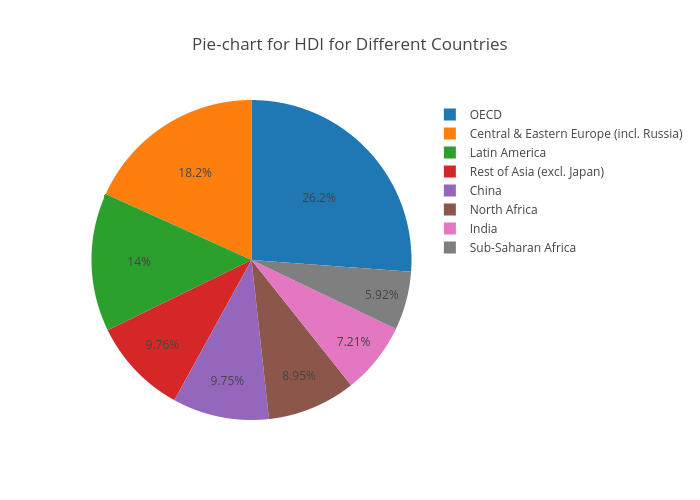
Rayyagari's interactive graph and data of "Pie-chart for HDI for Different Countries" is a pie. The x-axis shows values from 0 to 0. The y-axis shows values from 0 to 0.