Edit chart
Loading graph
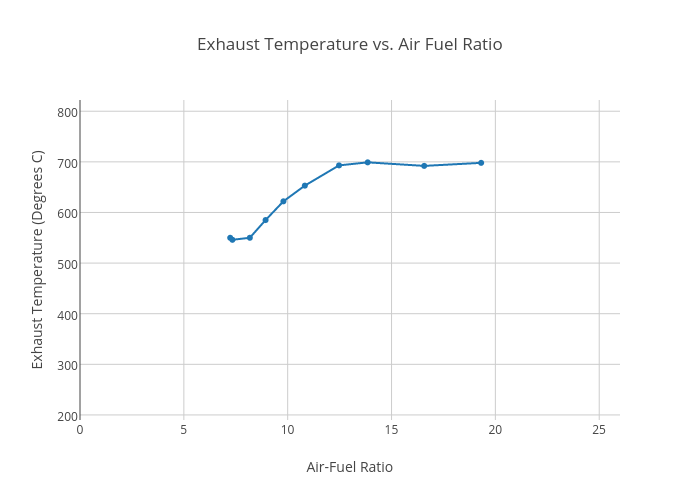
Raghdatayel's interactive graph and data of "Exhaust Temperature vs. Air Fuel Ratio" is a scatter chart, showing Exhaust Temperature (Degrees C); with Air-Fuel Ratio in the x-axis and Exhaust Temperature (Degrees C) in the y-axis.. The x-axis shows values from 0 to 26. The y-axis shows values from 190 to 822.1705089501812.