Edit chart
Loading graph
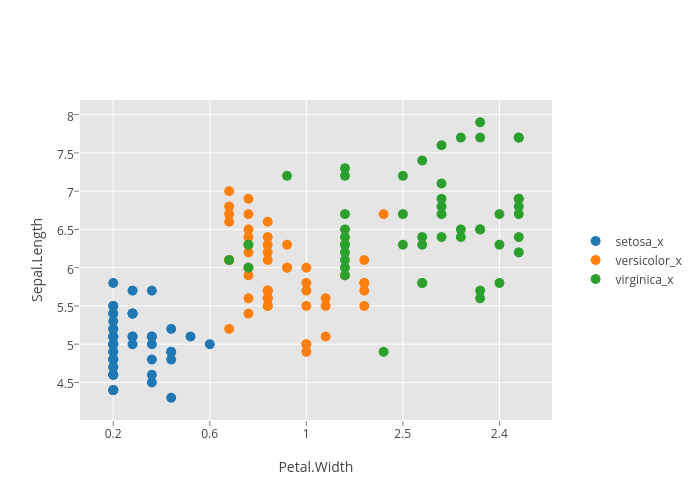
R_user_guide's interactive graph and data of "Sepal.Length vs Petal.Width" is a stacked bar chart, showing setosa_x, versicolor_x, virginica_x; with Petal.Width in the x-axis and Sepal.Length in the y-axis.. The x-axis shows values from -1.513558515699334 to 22.513558515699334. The y-axis shows values from 4.021777221526908 to 8.178222778473092.