Edit chart
Loading graph
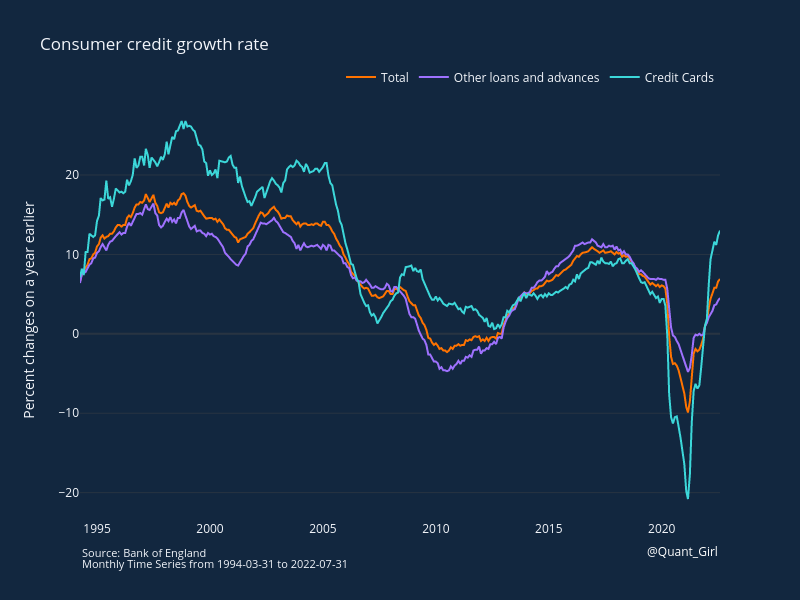
Quantgirluk's interactive graph and data of "Consumer credit growth rate" is a line chart, showing Total, Other loans and advances, Credit Cards; with Percent changes on a year earlier in the y-axis. The x-axis shows values from 0 to 0. The y-axis shows values from 0 to 0. This visualization has the following annotations: Source: Bank of England; Monthly Time Series from 1994-03-31 to 2022-07-31; @Quant_Girl