Edit chart
Loading graph
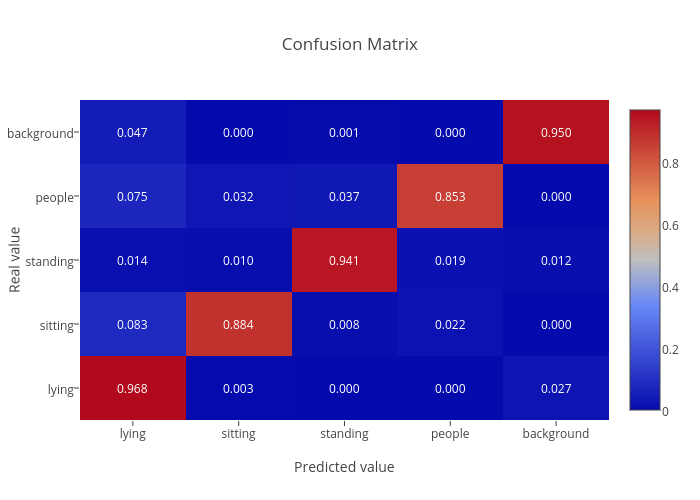
Pusiol's interactive graph and data of "Confusion Matrix" is a heatmap, showing y; with Predicted value in the x-axis and Real value in the y-axis.. The x-axis shows values from -0.5 to 4.5. The y-axis shows values from -0.5 to 4.5. This visualization has the following annotations: 0.968; 0.003; 0.000; 0.000; 0.027; 0.083; 0.884; 0.008; 0.022; 0.000; 0.014; 0.010; 0.941; 0.019; 0.012; 0.075; 0.032; 0.037; 0.853; 0.000; 0.047; 0.000; 0.001; 0.000; 0.950