Edit chart
Loading graph
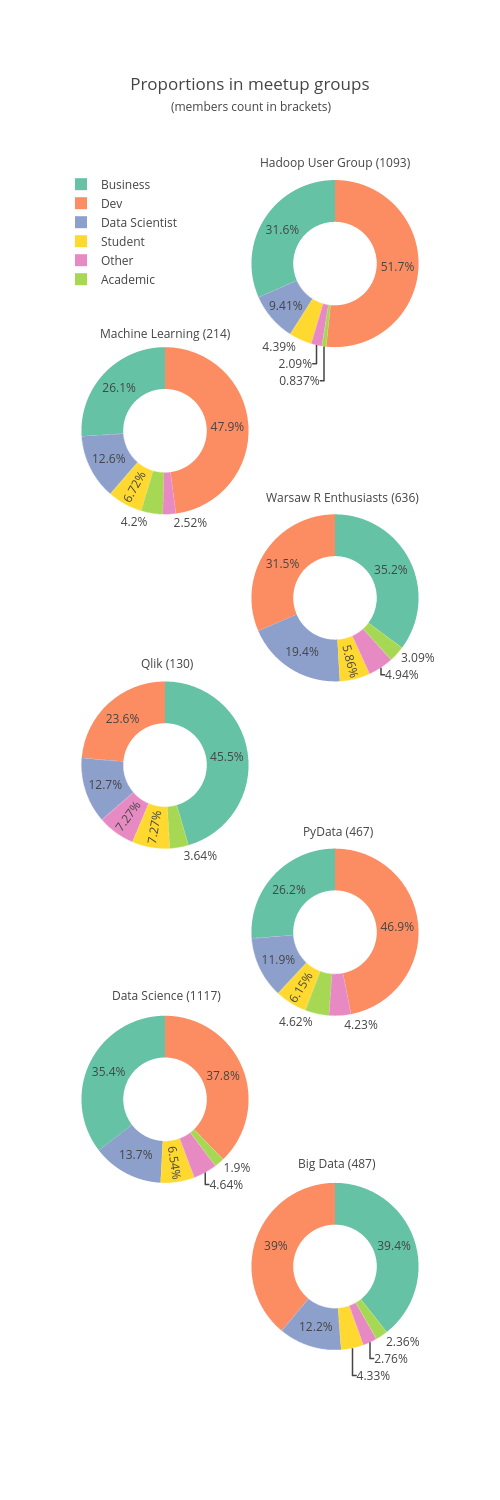
Przytu1's interactive graph and data of "Proportions in meetup groups" is a pie, showing Big Data, Data Science, PyData, Qlik, SER, Warsaw ML, WHUG. The x-axis shows values from 0 to 0. The y-axis shows values from 0 to 0. This visualization has the following annotations: Hadoop User Group (1093); Machine Learning (214); Warsaw R Enthusiasts (636); Qlik (130); PyData (467); Data Science (1117); Big Data (487); (members count in brackets)