Edit chart
Loading graph
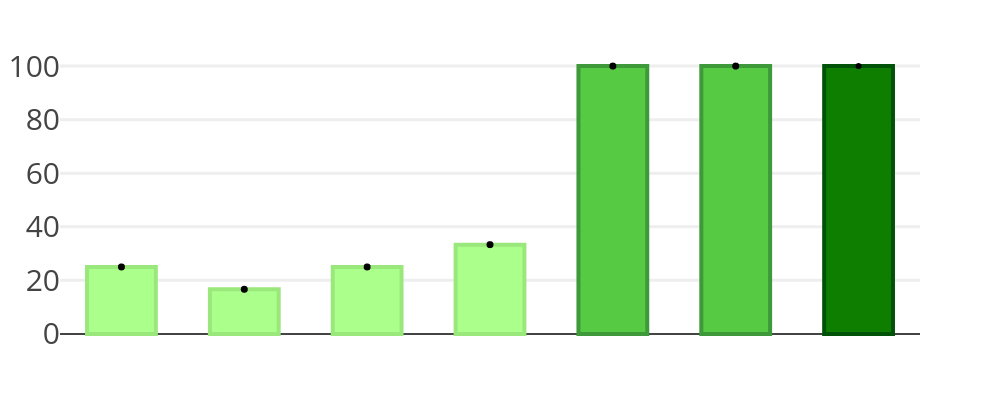
Prashp's interactive graph and data of " vs " is a grouped bar chart, showing A, C, E, A, C, E; with in the x-axis and in the y-axis.. The x-axis shows values from -0.5 to 6.5. The y-axis shows values from -6 to 106.