Edit chart
Loading graph
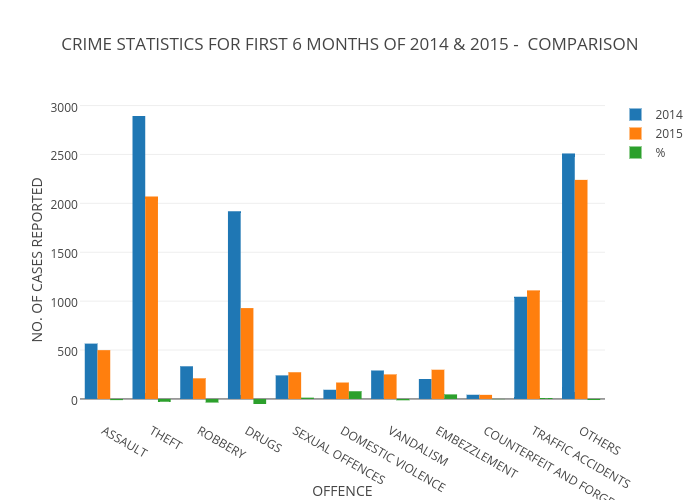
Policemv's interactive graph and data of "CRIME STATISTICS FOR FIRST 6 MONTHS OF 2014 & 2015 - COMPARISON" is a bar chart, showing 2014, 2015, %; with OFFENCE in the x-axis and NO. OF CASES REPORTED in the y-axis.. The x-axis shows values from -0.5 to 10.5. The y-axis shows values from -215.1783333333334 to 3056.5883333333336.