Edit chart
Loading graph
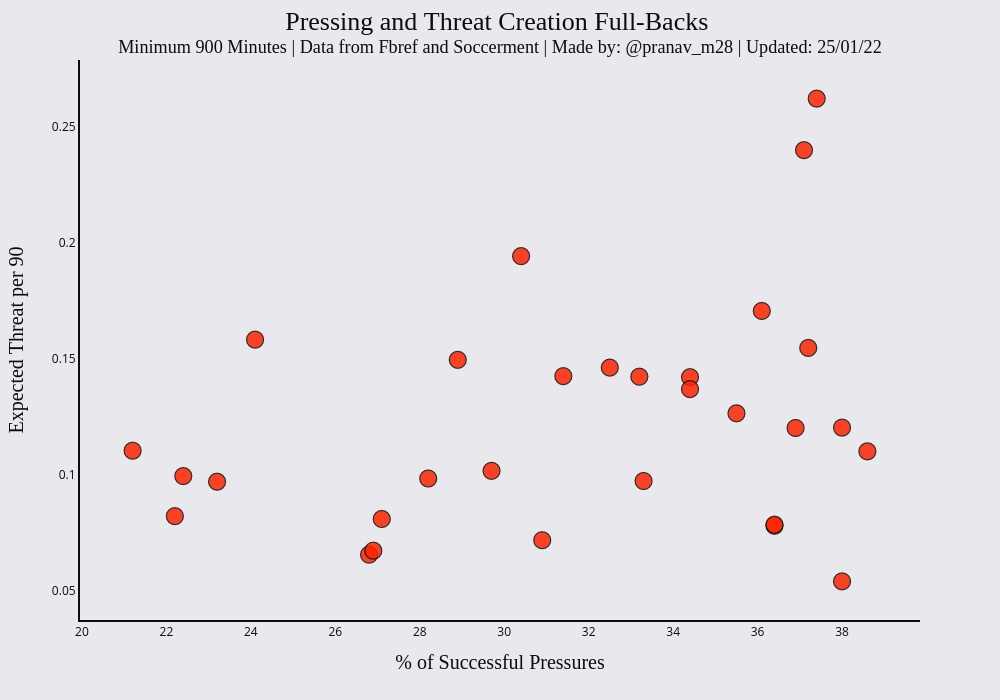
Pm28__'s interactive graph and data of "Pressing and Threat Creation Full-Backs Minimum 900 Minutes | Data from Fbref and Soccerment | Made by: @pranav_m28 | Updated: 25/01/22" is a scatter chart; with % of Successful Pressures in the x-axis and Expected Threat per 90 in the y-axis.. The x-axis shows values from 0 to 0. The y-axis shows values from 0 to 0.