Edit chart
Loading graph
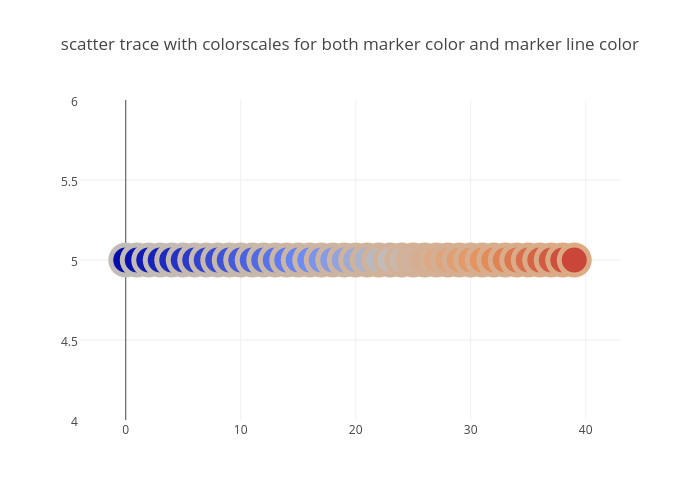
Plotly.js's interactive graph and data of "scatter trace with colorscales for both marker color and marker line color" is a scatter chart. The x-axis shows values from -3.19449715370019 to 42.19449715370019. The y-axis shows values from 4 to 6.