Edit chart
Loading graph
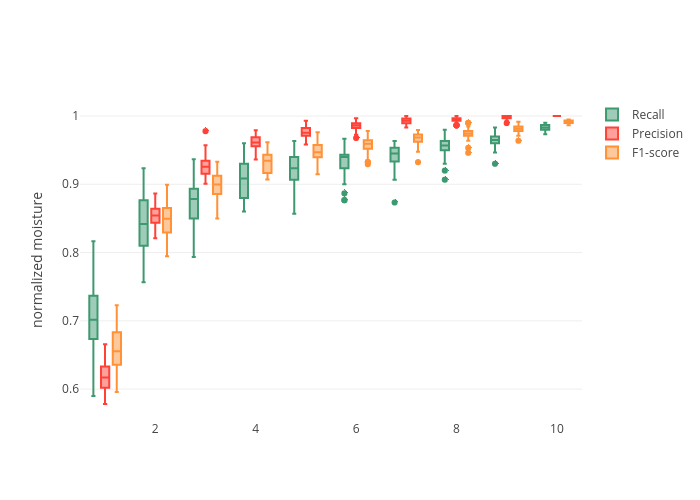
Pigs's interactive graph and data of "Recall, Precision, F1-score" is a box plot, showing Recall, Precision, F1-score; with normalized moisture in the y-axis. The x-axis shows values from 0 to 0. The y-axis shows values from 0 to 0.