Edit chart
Loading graph
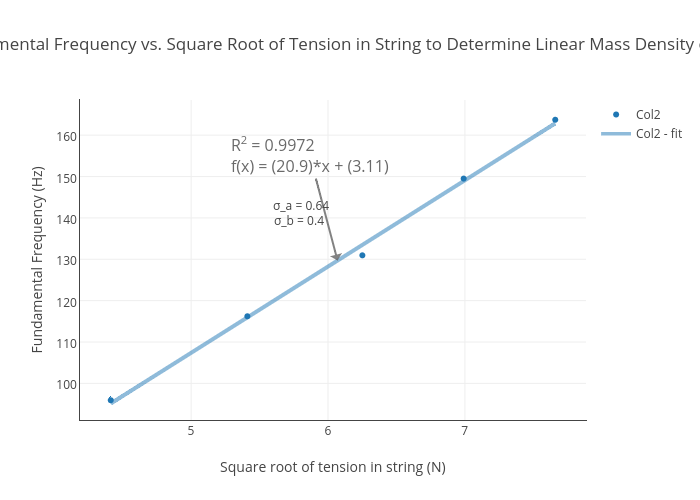
Physicsphun's interactive graph and data of "Fundamental Frequency vs. Square Root of Tension in String to Determine Linear Mass Density of Wire" is a scatter chart, showing Col2 vs Col2 - fit; with Square root of tension in string (N) in the x-axis and Fundamental Frequency (Hz) in the y-axis.. The x-axis shows values from 4.218221442246331 to 7.8547785577536695. The y-axis shows values from 91.29446288299657 to 168.25703788834832. This visualization has the following annotations: R2 = 0.9972f(x) = (20.9)*x + (3.11); σ_a = 0.64; σ_b = 0.4