Edit chart
Loading graph
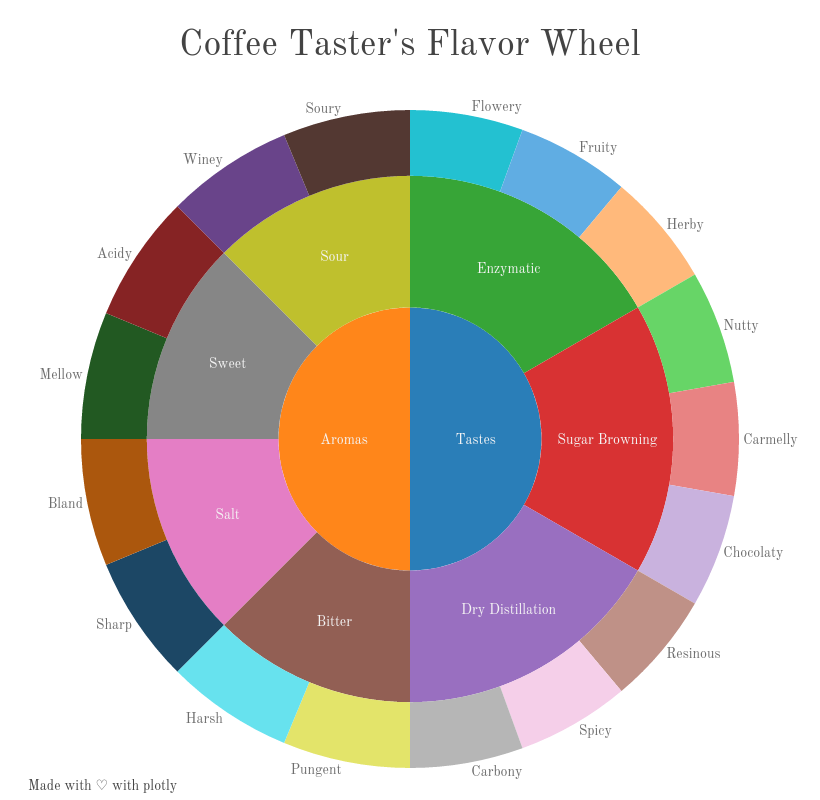
Phyllistay91's interactive graph and data of "Coffee Taster's Flavor Wheel" is a pie, showing Col2, Col4, Col6. The x-axis shows values from 0 to 0. The y-axis shows values from 0 to 0. This visualization has the following annotation: Made with ♡ with plotly