Edit chart
Loading graph
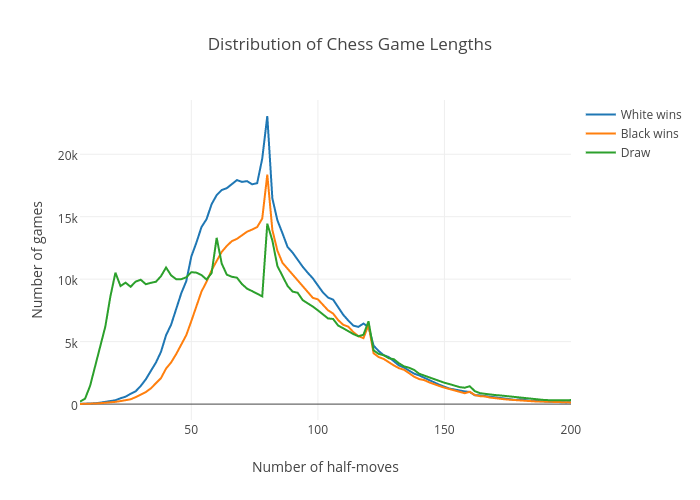
Peterellisjones's interactive graph and data of "Distribution of Chess Game Lengths" is a line chart, showing White wins, Black wins, Draw; with Number of half-moves in the x-axis and Number of games in the y-axis.. The x-axis shows values from 6 to 200. The y-axis shows values from -1272.6111111111115 to 24339.611111111113.