Edit chart
Loading graph
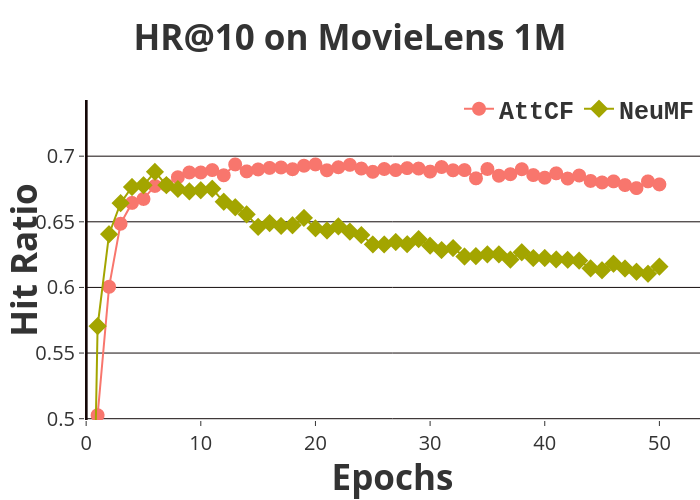
Pd90506's interactive graph and data of "HR@10 on MovieLens 1M" is a , showing AttCF vs NeuMF; with Epochs in the x-axis and Hit Ratio in the y-axis.. The x-axis shows values from -0.1 to 53.5411432160804. The y-axis shows values from 0.499 to 0.7428000485436893.