Edit chart
Loading graph
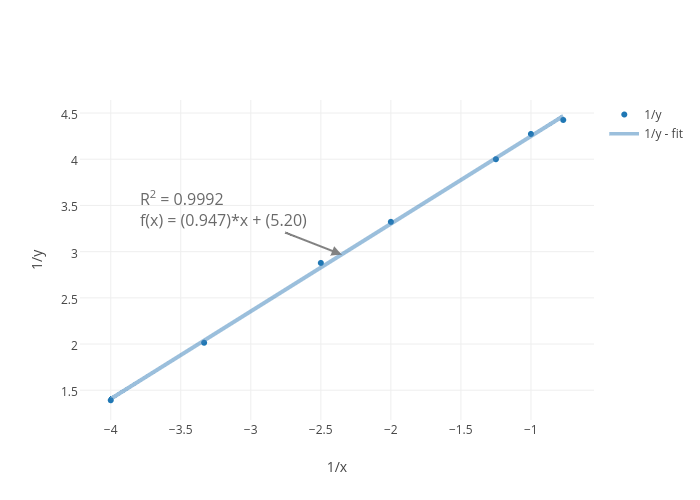
Patgab's interactive graph and data of "1/y vs 1/x" is a scatter chart, showing 1/y vs 1/y - fit; with 1/x in the x-axis and 1/y in the y-axis.. The x-axis shows values from -4.19614492236302 to -0.5730858468677493. The y-axis shows values from 1.1495474275408444 to 4.6670197816769825. This visualization has the following annotation: R2 = 0.9992f(x) = (0.947)*x + (5.20)