Edit chart
Loading graph
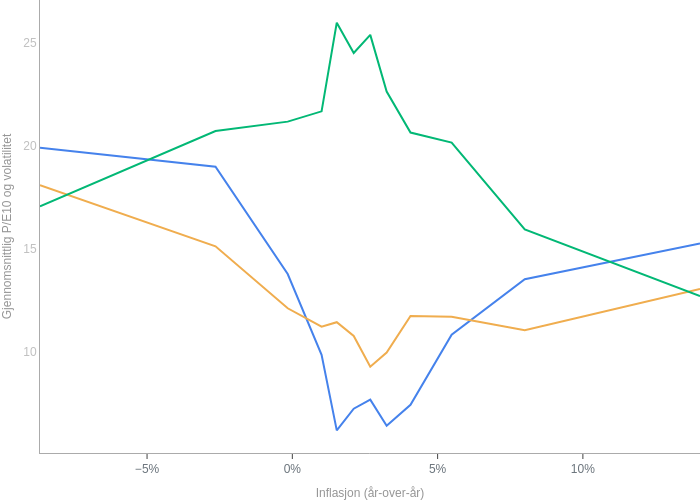
Oystein.nerva's interactive graph and data of "Gjennomsnittlig P/E10 og volatilitet vs Inflasjon (år-over-år)" is a line chart, showing Infl. Vol. *, Aksjer Vol., P/E 10; with Inflasjon (år-over-år) in the x-axis and Gjennomsnittlig P/E10 og volatilitet in the y-axis.. The x-axis shows values from 0 to 0. The y-axis shows values from 0 to 0.