Edit chart
Loading graph
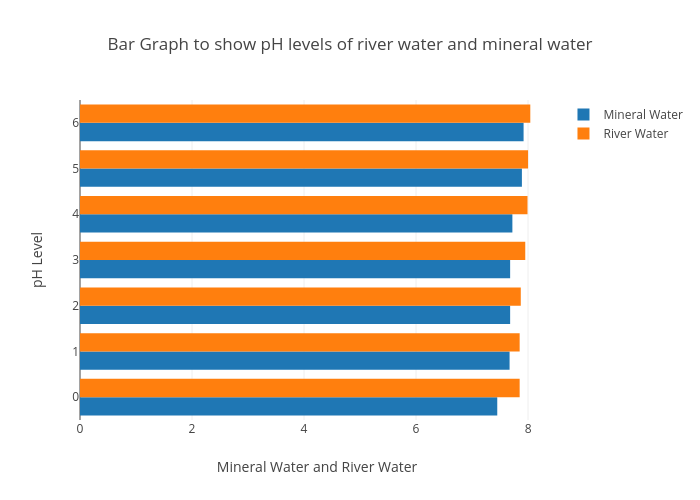
Oshin.joshipura's interactive graph and data of "Bar Graph to show pH levels of river water and mineral water" is a bar chart, showing Mineral Water vs River Water ; with Mineral Water and River Water in the x-axis and pH Level in the y-axis.. The x-axis shows values from 0 to 8.463157894736842. The y-axis shows values from -0.5 to 6.5.