Edit chart
Loading graph
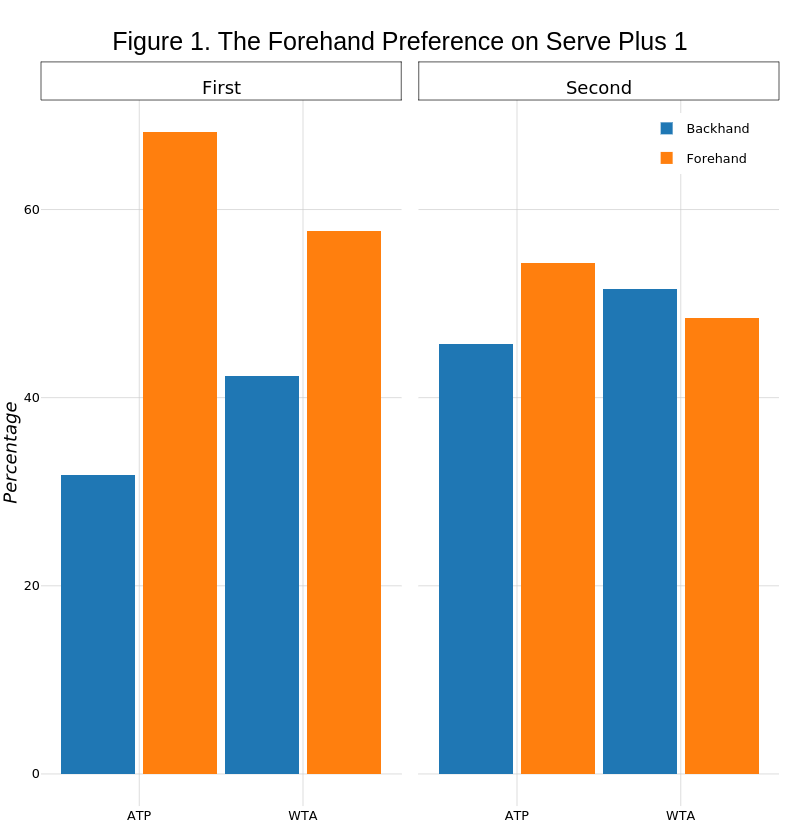
On-the-t's interactive graph and data of "Figure 1. The Forehand Preference on Serve Plus 1" is a stacked bar chart, showing Backhand, Backhand, Forehand, Forehand. The x-axis shows values from 0.4 to 2.6. The y-axis shows values from -3.41144517433047 to 71.6403486609399. This visualization has the following annotations: Percentage ; First; Second