Edit chart
Loading graph
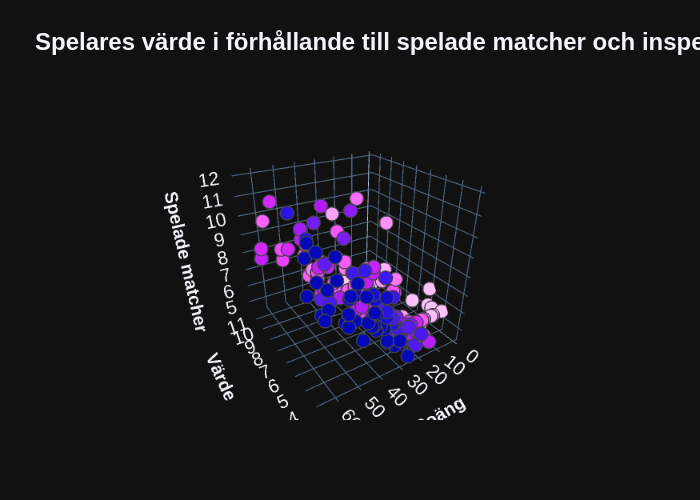
Olallidmark's interactive graph and data of "Spelares värde i förhållande till spelade matcher och inspelade poäng" is a scatter3d. The x-axis shows values from -1 to 6. The y-axis shows values from -1 to 4.