Edit chart
Loading graph
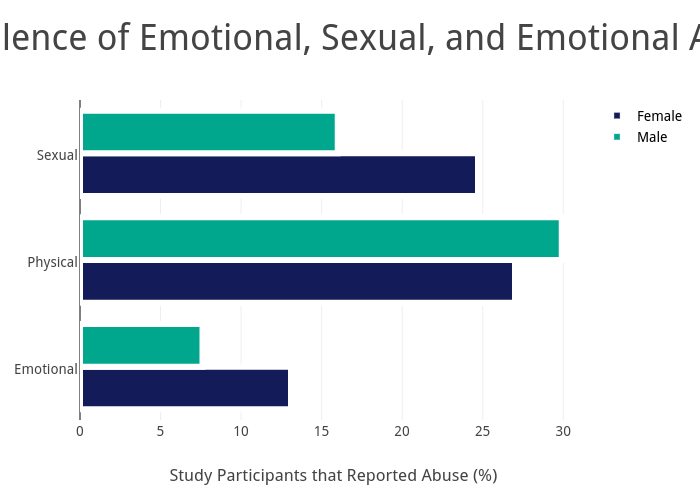
Nv16.carter's interactive graph and data of "Prevalence of Emotional, Sexual, and Emotional Abuse" is a grouped bar chart, showing Female vs Male; with Study Participants that Reported Abuse (%) in the x-axis. The x-axis shows values from 0 to 31.473684210526315. The y-axis shows values from -0.5 to 2.5.