Edit chart
Loading graph
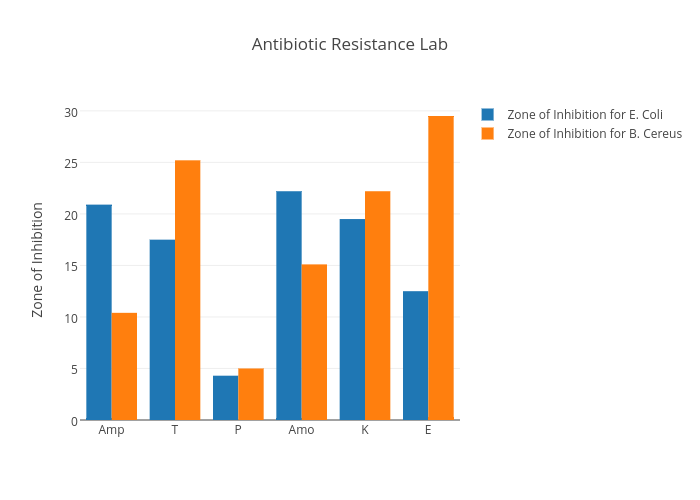
Nolen.bradburn's interactive graph and data of "Antibiotic Resistance Lab" is a bar chart, showing Zone of Inhibition for E. Coli vs Zone of Inhibition for B. Cereus; with Zone of Inhibition in the y-axis. The x-axis shows values from -0.5 to 5.5. The y-axis shows values from 0 to 31.05263157894737.