Edit chart
Loading graph
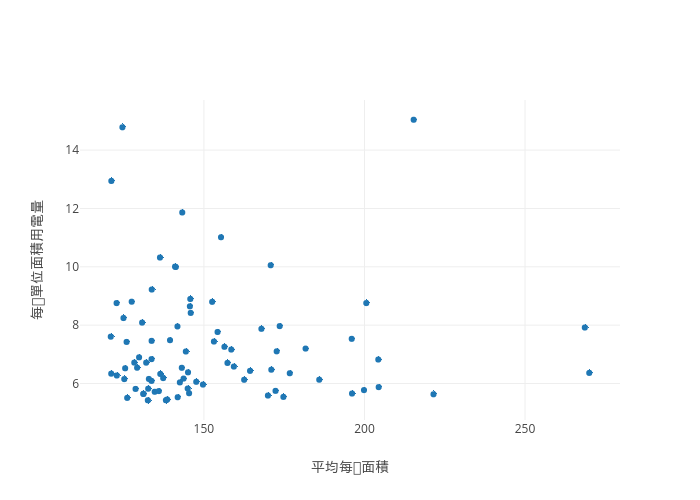
Nispc's interactive graph and data of "每戶單位面積用電量 vs 平均每戶面積" is a scatter chart, showing 用電數據_I; with 平均每戶面積 in the x-axis and 每戶單位面積用電量 in the y-axis.. The x-axis shows values from 0 to 0. The y-axis shows values from 0 to 0.