Edit chart
Loading graph
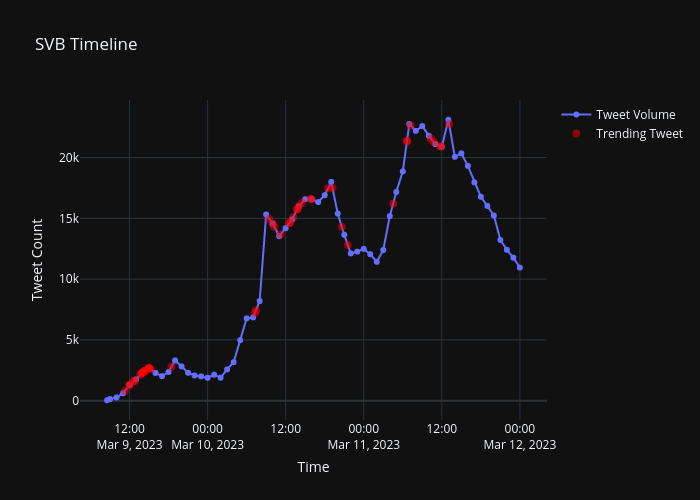
Nickpeakmetrics's interactive graph and data of "SVB Timeline" is a line chart, showing Tweet Volume vs Trending Tweet; with Time in the x-axis and Tweet Count in the y-axis.. The x-axis shows values from 2023-03-09 04:45:56.1265 to 2023-03-12 03:47:02.8735. The y-axis shows values from -1383.221811057902 to 24530.2218110579.