Edit chart
Loading graph
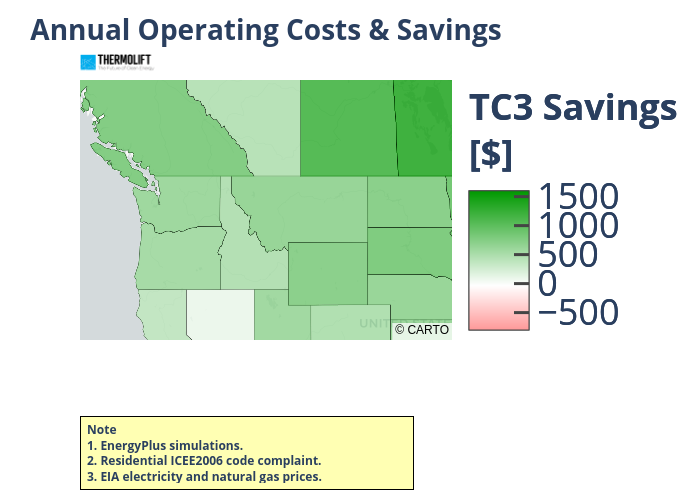
Nevr1106's interactive graph and data of "Annual Operating Costs & Savings" is a choroplethmapbox. The x-axis shows values from 0 to 0. The y-axis shows values from 0 to 0. This visualization has the following annotation: Note 1. EnergyPlus simulations. 2. Residential ICEE2006 code complaint. 3. EIA electricity and natural gas prices.