Edit chart
Loading graph
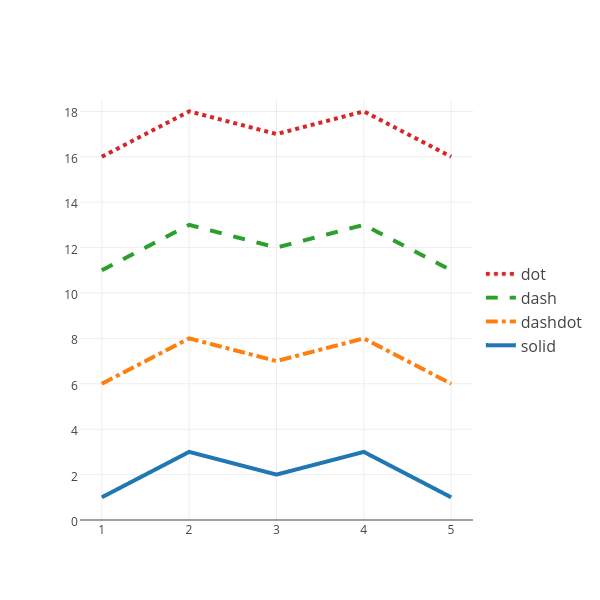
Neda's interactive graph and data of "solid, dashdot, dash, dot" is a line chart, showing solid, dashdot, dash, dot. The x-axis shows values from 0.75 to 5.25. The y-axis shows values from 0 to 18.5.