Edit chart
Loading graph
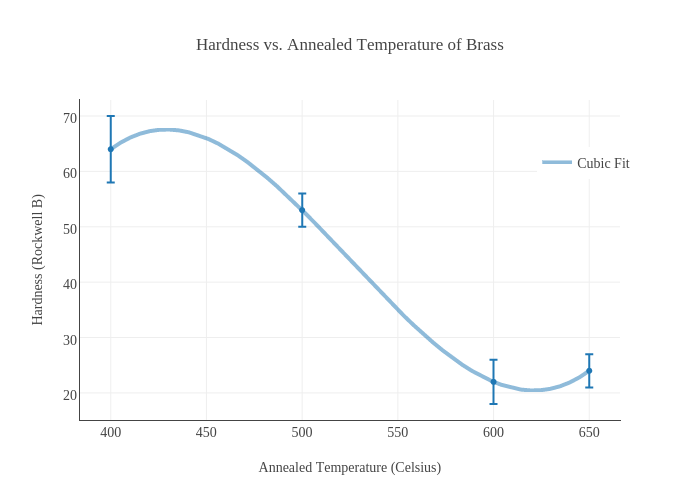
Mxlaferr's interactive graph and data of "Hardness vs. Annealed Temperature of Brass" is a scatter chart, showing Col2 vs Cubic Fit; with Annealed Temperature (Celsius) in the x-axis and Hardness (Rockwell B) in the y-axis.. The x-axis shows values from 385.31381553769614 to 664.6861844623039. The y-axis shows values from 15.11111111111111 to 72.88888888888889.