Edit chart
Loading graph
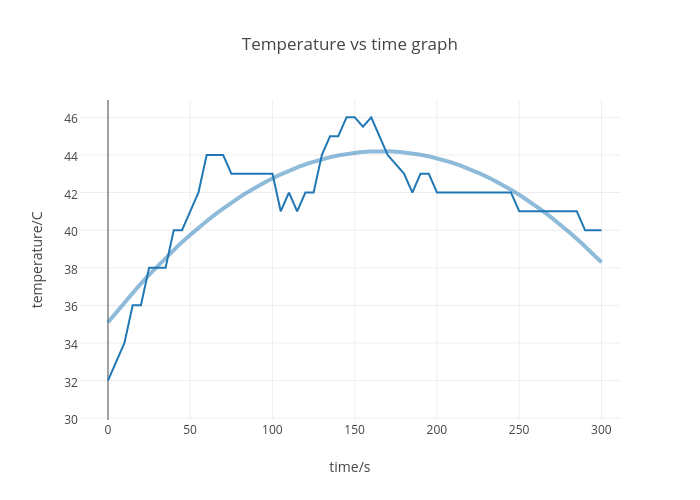
Mukundn.narasimhan's interactive graph and data of "Temperature vs time graph" is a scatter chart, showing Col1 vs Col1 - fit; with time/s in the x-axis and temperature/C in the y-axis.. The x-axis shows values from -17.008234776378913 to 311.24405033518457. The y-axis shows values from 29.90169606949496 to 46.9221849271316.