Edit chart
Loading graph
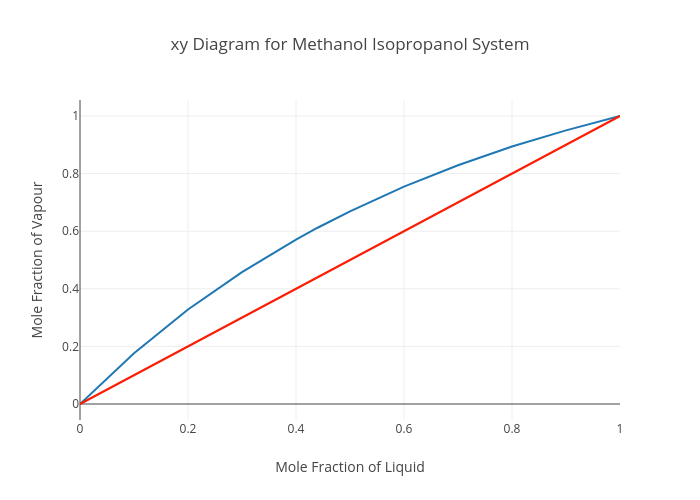
Mthallma's interactive graph and data of "xy Diagram for Methanol Isopropanol System" is a line chart, showing trace 0; with Mole Fraction of Liquid in the x-axis and Mole Fraction of Vapour in the y-axis.. The x-axis shows values from 0 to 1. The y-axis shows values from -0.055555555555555566 to 1.0555555555555556.