Edit chart
Loading graph
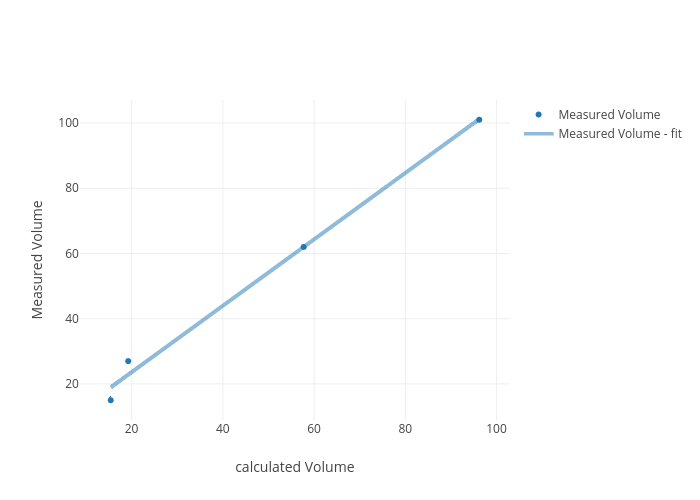
Mrubio066's interactive graph and data of "Measured Volume vs calculated Volume" is a scatter chart, showing Measured Volume vs Measured Volume - fit; with calculated Volume in the x-axis and Measured Volume in the y-axis.. The x-axis shows values from 9.590849673202614 to 102.0091503267974. The y-axis shows values from 8.823575331772055 to 107.17642466822795.