Edit chart
Loading graph
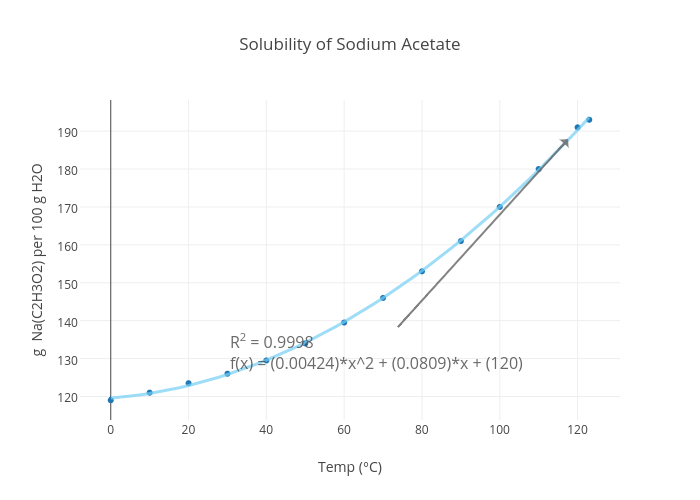
Mrericsully's interactive graph and data of "Solubility of Sodium Acetate" is a scatter chart, showing g Na(C2H3O2)/ 100 g H2O vs g Na(C2H3O2)/ 100 g H2O - fit; with Temp (°C) in the x-axis and g Na(C2H3O2) per 100 g H2O in the y-axis.. The x-axis shows values from -7.6460513796384415 to 130.64605137963844. The y-axis shows values from 113.60416666666667 to 198.39583333333334. This visualization has the following annotation: R2 = 0.9998f(x) = (0.00424)*x^2 + (0.0809)*x + (120)