Edit chart
Loading graph
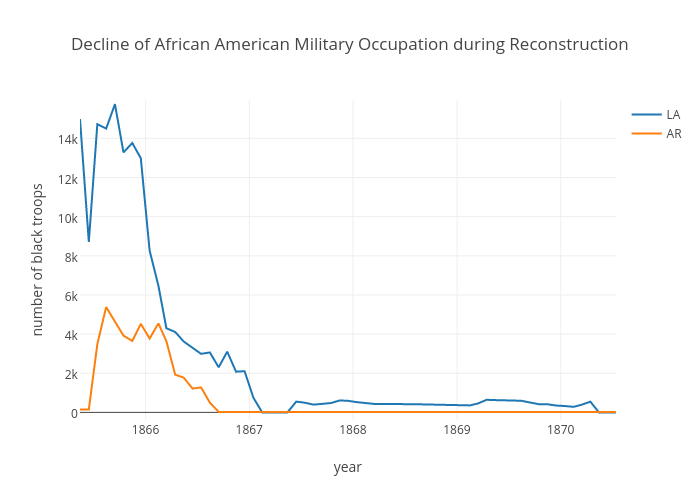
Mowusu's interactive graph and data of "Decline of African American Military Occupation during Reconstruction " is a line chart, showing LA vs AR; with year in the x-axis and number of black troops in the y-axis.. The x-axis shows values from 1865-05-15 to 1870-07-14 03:08:12.4012. The y-axis shows values from -388.8806741718069 to 15959.678647862094.