Edit chart
Loading graph
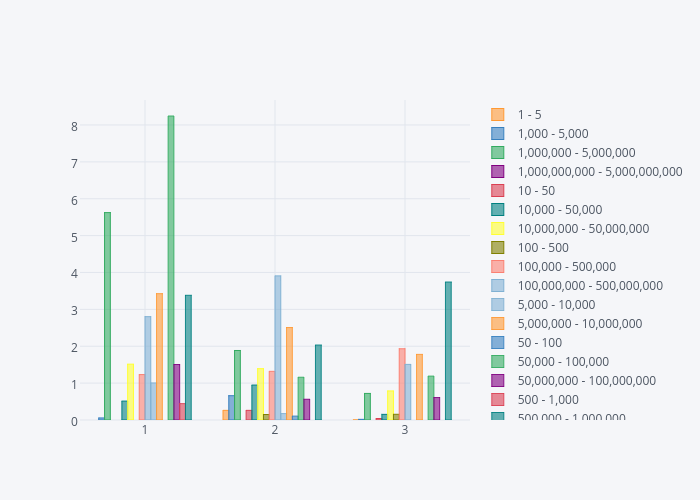
Mikebsagan's interactive graph and data of "1 - 5, 1,000 - 5,000, 1,000,000 - 5,000,000, 1,000,000,000 - 5,000,000,000, 10 - 50, 10,000 - 50,000, 10,000,000 - 50,000,000, 100 - 500, 100,000 - 500,000, 100,000,000 - 500,000,000, 5,000 - 10,000, 5,000,000 - 10,000,000, 50 - 100, 50,000 - 100,000, 50,000,000 - 100,000,000, 500 - 1,000, 500,000 - 1,000,000, 500,000,000 - 1,000,000,000" is a bar chart, showing 1 - 5, 1,000 - 5,000, 1,000,000 - 5,000,000, 1,000,000,000 - 5,000,000,000, 10 - 50, 10,000 - 50,000, 10,000,000 - 50,000,000, 100 - 500, 100,000 - 500,000, 100,000,000 - 500,000,000, 5,000 - 10,000, 5,000,000 - 10,000,000, 50 - 100, 50,000 - 100,000, 50,000,000 - 100,000,000, 500 - 1,000, 500,000 - 1,000,000, 500,000,000 - 1,000,000,000. The x-axis shows values from 0 to 0. The y-axis shows values from 0 to 0.