Edit chart
Loading graph
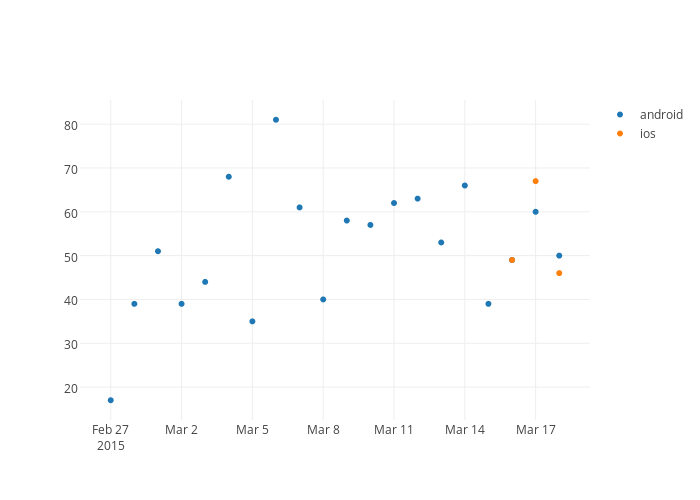
Michaelzh's interactive graph and data of "android vs ios" is a scatter chart, showing android vs ios; with time in the x-axis. The x-axis shows values from 1424926438130.949 to 1426759561869.051. The y-axis shows values from 13.014821975189303 to 84.9851780248107.