Edit chart
Loading graph
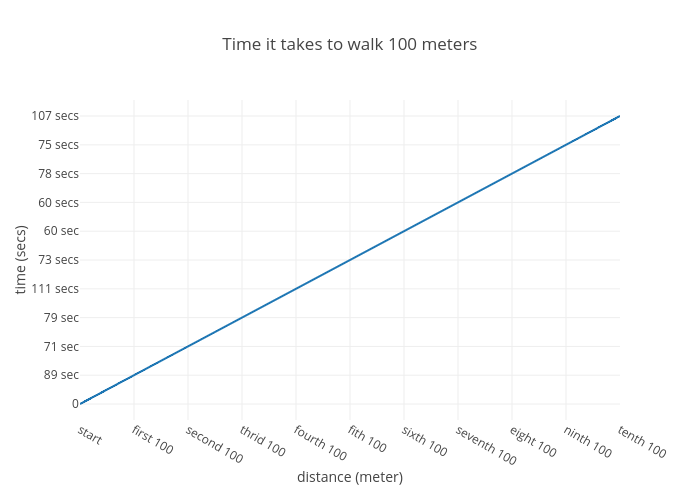
Miamahaffey's interactive graph and data of "Time it takes to walk 100 meters" is a line chart, showing B; with distance (meter) in the x-axis and time (secs) in the y-axis.. The x-axis shows values from 0 to 10. The y-axis shows values from -0.5555555555555556 to 10.555555555555555.