Edit chart
Loading graph
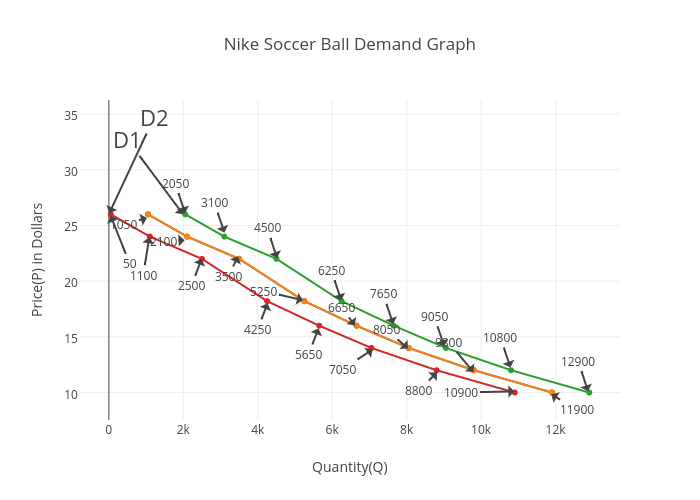
Metaksu's interactive graph and data of "Nike Soccer Ball Demand Graph" is a scatter chart, showing Col2, Price(P) in Dollars, Price(P) in Dollars, Price(P) in Dollars; with Quantity(Q) in the x-axis and Price(P) in Dollars in the y-axis.. The x-axis shows values from -713.4782810039828 to 13663.478281003983. The y-axis shows values from 8.504970172964924 to 31.953625381434794. This visualization has the following annotations: 1050; 5250; 3500; 2100; 6650; 8050; 9800; 11900; 2050; 3100; 4500; 6250; 7650; 9050; 10800; 12900; D1; D2; 50; 1100; 2500; 4250; 5650; 7050; 8800; 10900