Edit chart
Loading graph
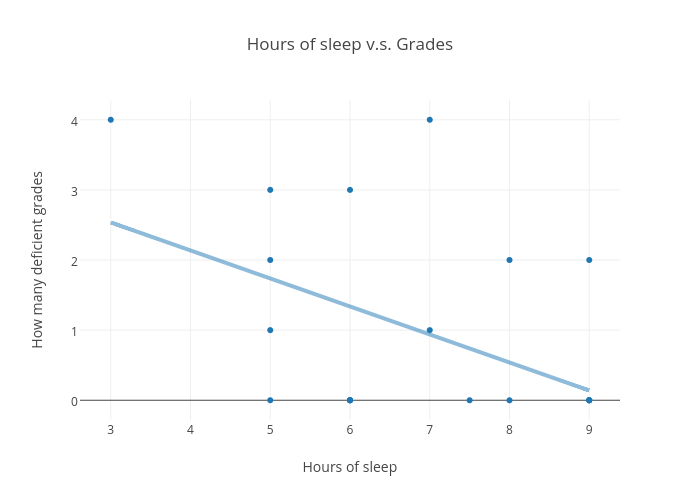
Mendy's interactive graph and data of "Hours of sleep v.s. Grades" is a scatter chart, showing Col2 vs Col2 - fit; with Hours of sleep in the x-axis and How many deficient grades in the y-axis.. The x-axis shows values from 2.639209225700165 to 9.360790774299835. The y-axis shows values from -0.2559740785743216 to 4.255974078574321.