Edit chart
Loading graph
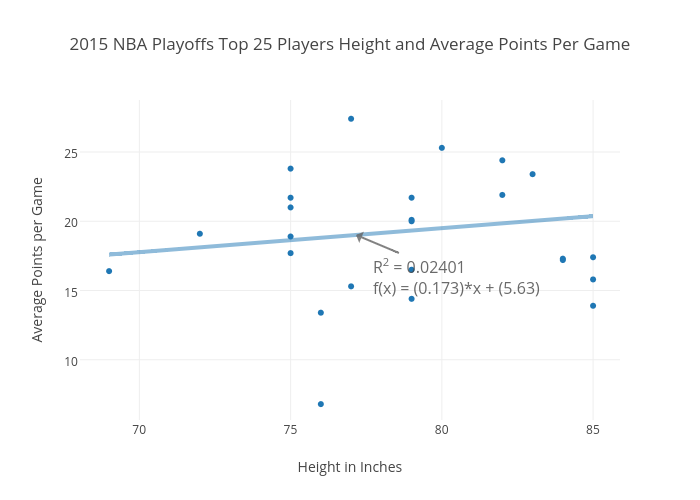
Mendy's interactive graph and data of "2015 NBA Playoffs Top 25 Players Height and Average Points Per Game" is a scatter chart, showing Col2 vs Col2 - fit; with Height in Inches in the x-axis and Average Points per Game in the y-axis.. The x-axis shows values from 68.03784289134278 to 85.89002645363502. The y-axis shows values from 5.652573565887147 to 28.75394749830452. This visualization has the following annotation: R2 = 0.02401f(x) = (0.173)*x + (5.63)