Edit chart
Loading graph
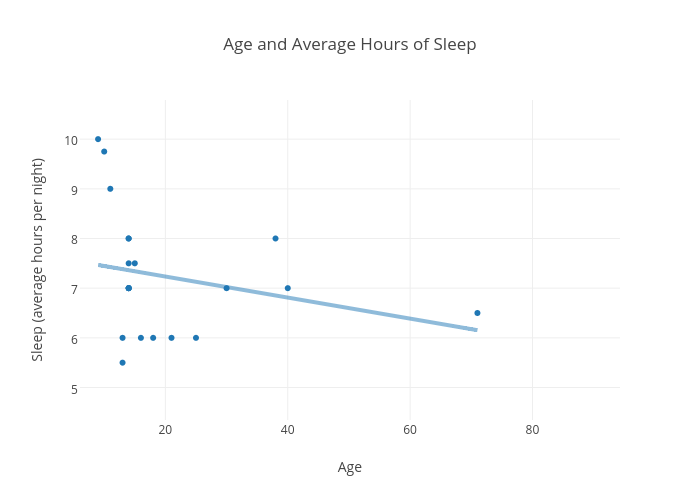
Mendy's interactive graph and data of "Age and Average Hours of Sleep" is a scatter chart, showing y vs y - fit; with Age in the x-axis and Sleep (average hours per night) in the y-axis.. The x-axis shows values from 6.045015083339621 to 94.30047777940277. The y-axis shows values from 4.346201728496076 to 10.787569529294027.