Edit chart
Loading graph
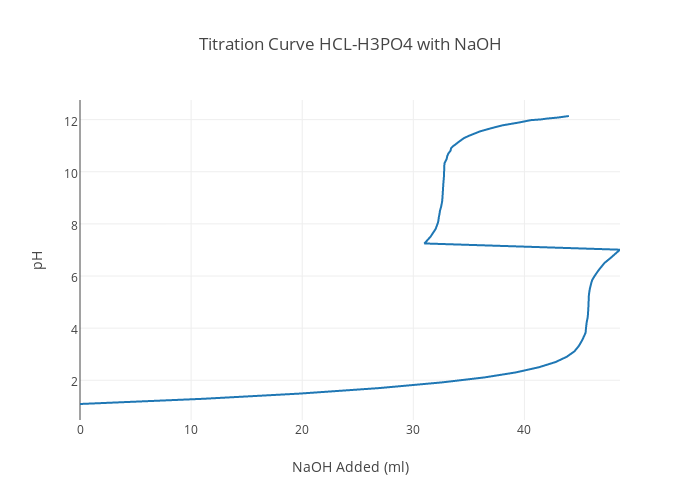
Meerika's interactive graph and data of "Titration Curve HCL-H3PO4 with NaOH" is a scatter chart, showing Col1; with NaOH Added (ml) in the x-axis and pH in the y-axis.. The x-axis shows values from 0 to 48.6. The y-axis shows values from 0.47611111111111104 to 12.75388888888889.