Edit chart
Loading graph
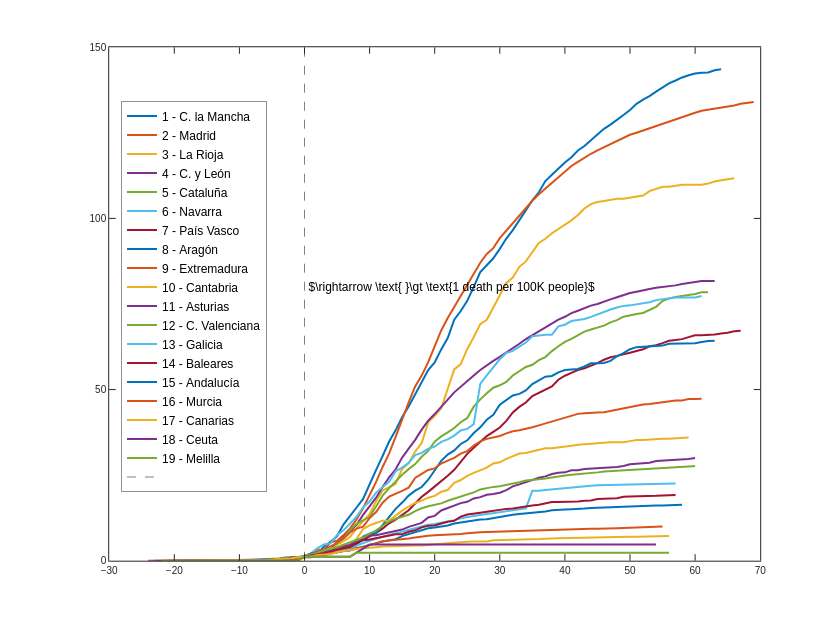
Mathplot's interactive graph and data of "" is a line chart, showing 1 - C. la Mancha, 2 - Madrid, 3 - La Rioja, 4 - C. y León, 5 - Cataluña, 6 - Navarra, 7 - País Vasco, 8 - Aragón, 9 - Extremadura, 10 - Cantabria, 11 - Asturias, 12 - C. Valenciana, 13 - Galicia, 14 - Baleares, 15 - Andalucía, 16 - Murcia, 17 - Canarias, 18 - Ceuta, 19 - Melilla, . The x-axis shows values from 0 to 0. The y-axis shows values from 0 to 0. This visualization has the following annotations: ; $\rightarrow \text{ }\gt \text{1 death per 100K people}$